Engage dashboards in Radarr by Genesys
Radarr by Genesys allows you to track conversations with customers and turn them into actionable insights to improve performance.
The following dashboards are available in Engage
- SLA Dashboard
- Team Overview Dashboard
- CSAT Dashboard
- Ticket Analysis Dashboard
- SLA Dashboard
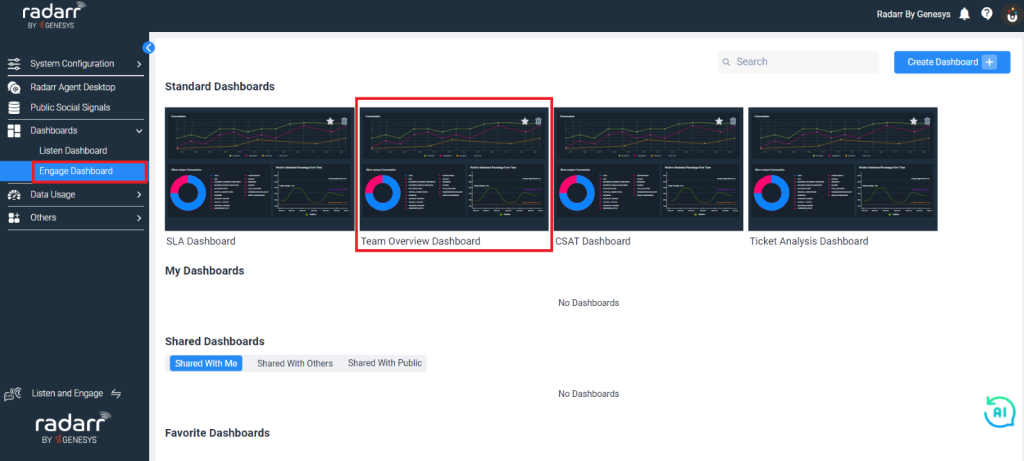
On the platform’s left side, click Engage Dashboard, then SLA Dashboard.
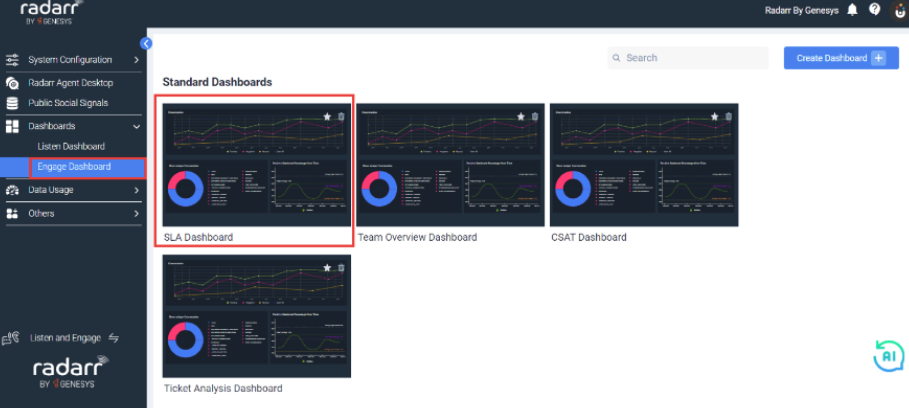
Once you have reached SLA Dashboard, you will be able to monitor your customer interactions through a series of reports that provide an overview of your chat and agent activity. You can use this information to optimize and improve the effectiveness of your customer service strategy.
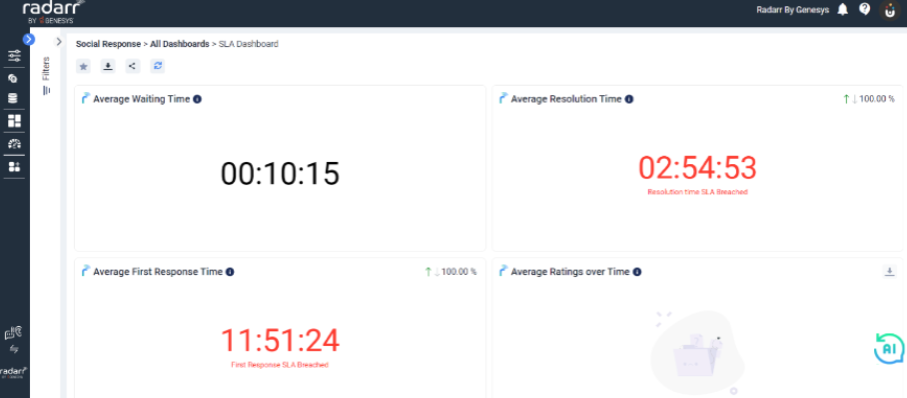
The filter panel on the left allows you to select required social profiles, and you can further narrow down your analytics section by ticket status or ticket tags, duration, and sentiment.
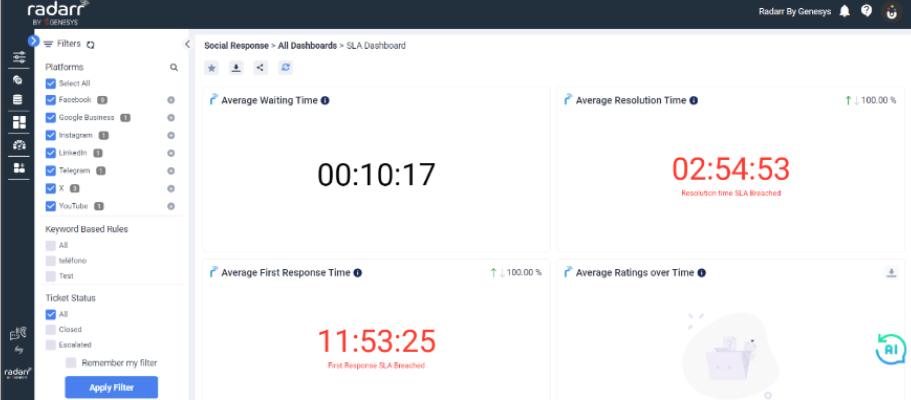
You are all set to view the activity breakdown as shown below.
The platform has all the necessary components to track the conversations you have with customers and convert them into actionable insights.

- Average First Response Time is the average time it takes for all agents to respond to a ticket.
- Average Resolution Time refers to the average time it takes an agent to resolve a ticket.
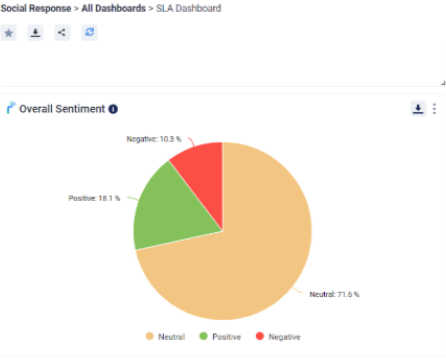
The SLA Dashboard also includes Overall Sentiment, which shows a breakdown of all tickets by sentiment (positive, negative, or neutral). The chart does not consider the information from agent replies.
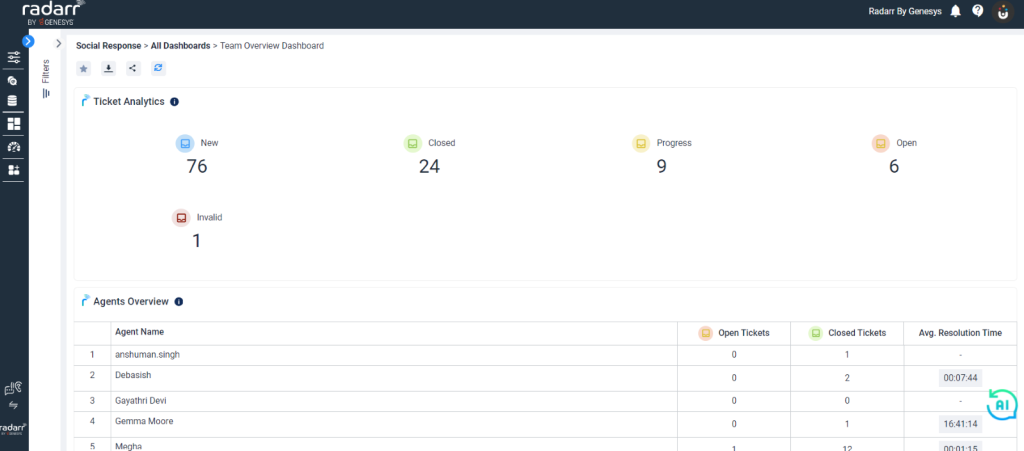
- Team Overview Dashboard
The Team Overview Dashboard provides a breakdown of the number of open and closed tickets, average resolution time, and agent name.
- CSAT Dashboard
The CSAT Dashboard displays data based on customer survey responses.
The following charts are available under CSAT Dashboard.
- CSAT Score
- NPS Score
- CSAT over Time
- CSAT by Agent
- Platform wise Sentiment
- CSAT by Platform
CSAT Score:
Customer Satisfaction Score, or CSAT score, is a customer experience metric that assesses satisfaction with a product, service, or customer support interaction using a customer satisfaction survey. We calculate this using the formula CSAT score = number of surveys with 4 or 5 stars / total surveys received * 100.
Select the profile and apply the necessary filters to display the CSAT score.
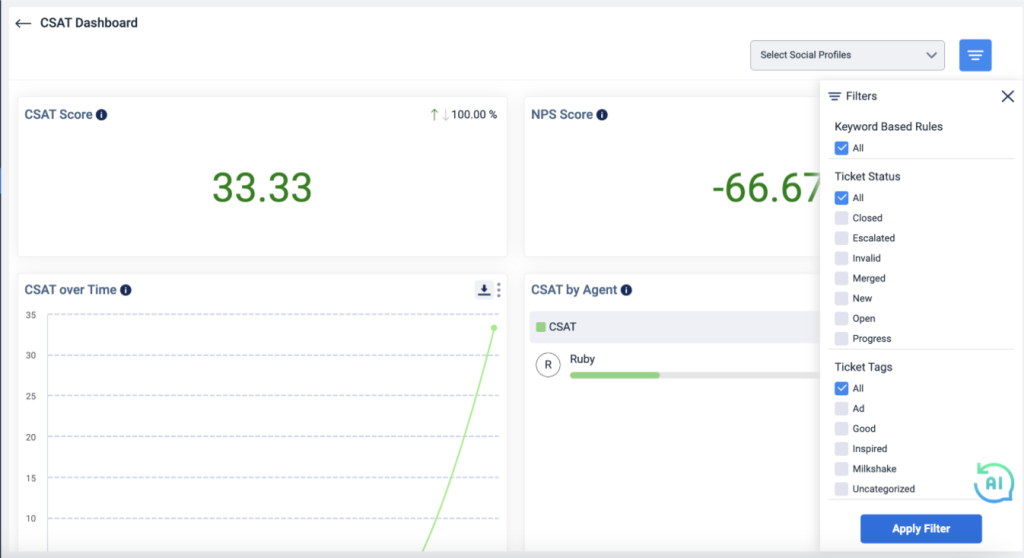
Fig: CSAT Score
NPS Score:
Net Promoter Score (NPS) measures customer loyalty and satisfaction by asking them to rate their likelihood of recommending your product or service on a scale of 0 to 10. The formula for calculating this is (promoters (9-10) – detractors (0-6))/total_hits *100.
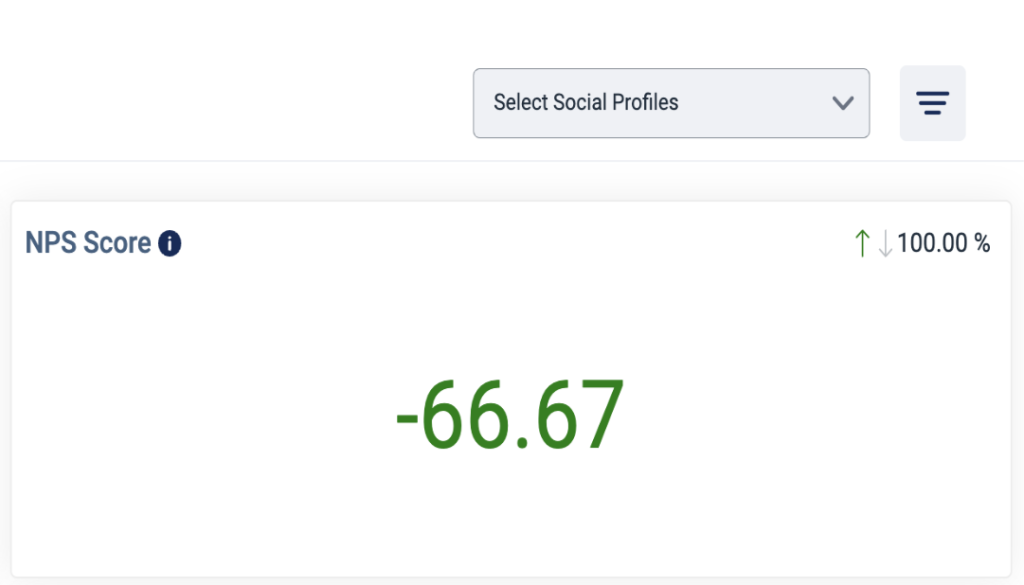
Fig: Example of NPS Score for selected profiles and filters
CSAT Over Time
This chart depicts your customer satisfaction score over time.
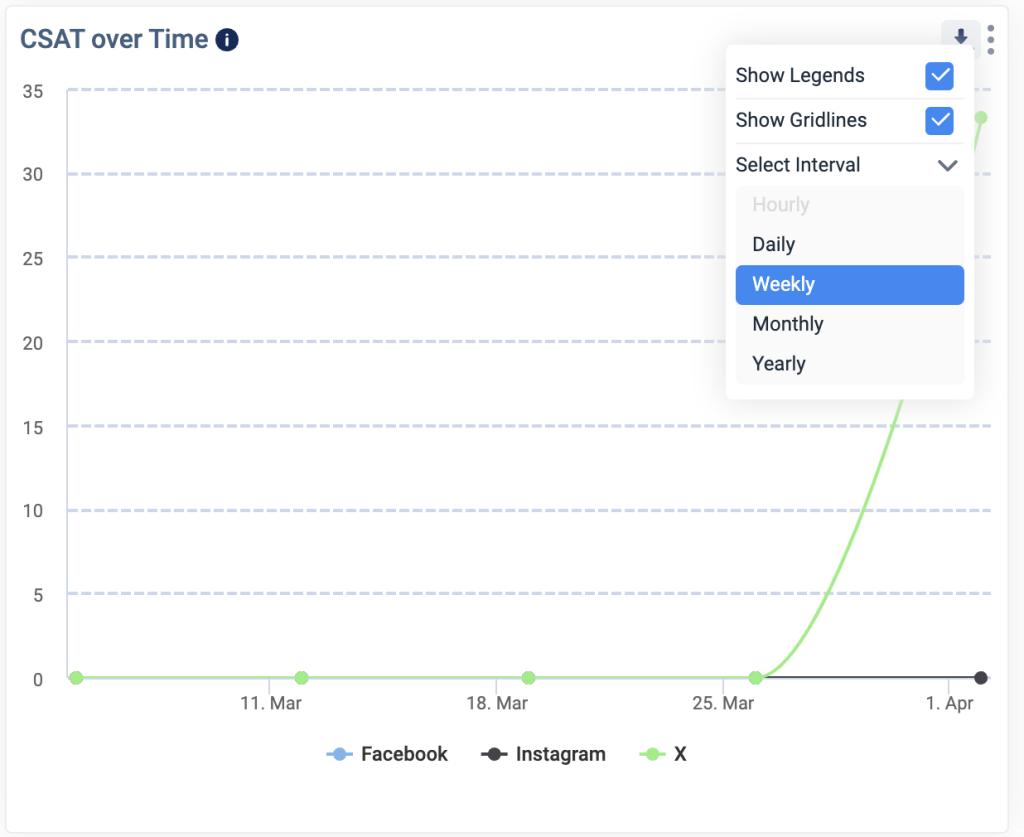
Fig: CSAT over time
- We can choose the interval as daily, weekly, monthly, or yearly.
- The chart can be downloaded in either CSV or PNG format.
CSAT by Agent
This chart shows the total number of tickets responded to by each agent, as well as the percentage of tickets that received 4 or 5 stars (CSAT).

Platform Wise Sentiment
This chart displays positive, negative, and neutral sentiments for each platform, as well as the total number of tickets.

CSAT by Platform
This chart represents platform-wise total number of tickets that received response to the survey and CSAT out of those.
How many tickets received a four or five star rating.

- Ticket Analysis Dashboard
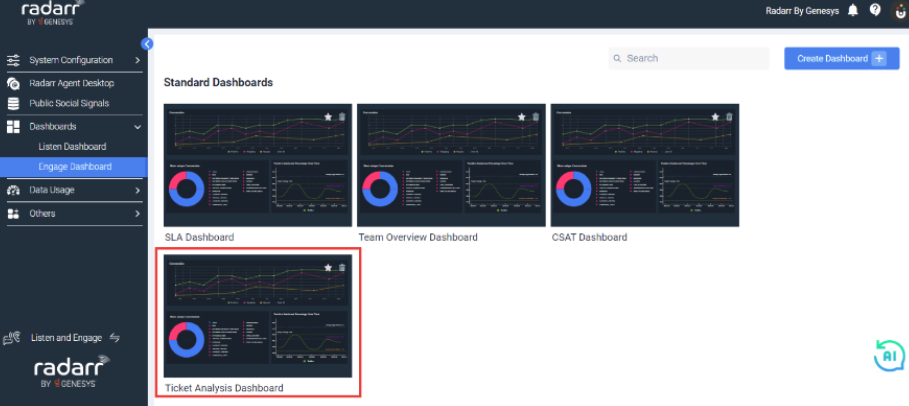
Ticket Analytics: Displays tickets according to their status, indicating how many are in progress versus new/waiting to be responded to.
Volume of Inbox: The number of tickets received over time per page.
Peak Time: The time-of-day chart depicts the number of tickets issued per day and month. The chart does not consider the data from the agent replies.
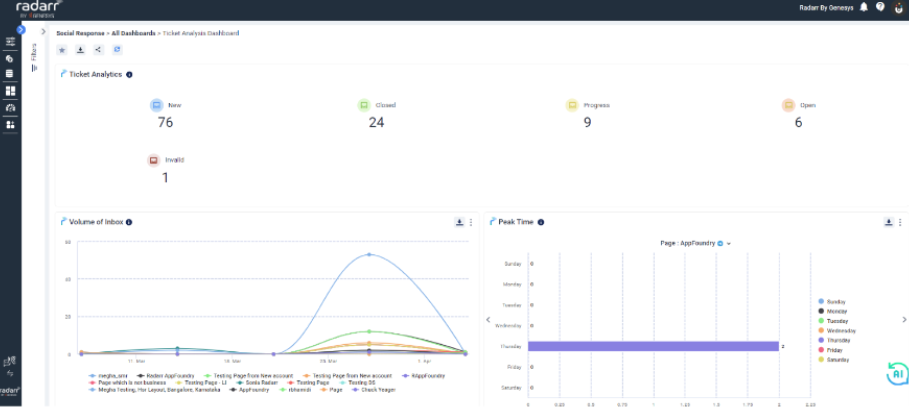
The Ticket Analysis Dashboard also features Messages over Time, Platform Analytics, and Early Warning System –
Message Over Time: Displays the messages that occur over time. Incoming messages are messages received from your customers, while outgoing messages are messages sent by your customer service agents to your customers, including any auto-responses you have set.
Platform Analytics: Displays a breakdown of tickets by platform. The chart does not consider the information from agent replies.
Early Warning System: This highlights tickets that have not been responded to for more than one hour. It aids in the identification of unresolved issues that require immediate attention.

