Radarr By Genesys Help and Support
What are chart-level filters? How to use them?
Table of Contents
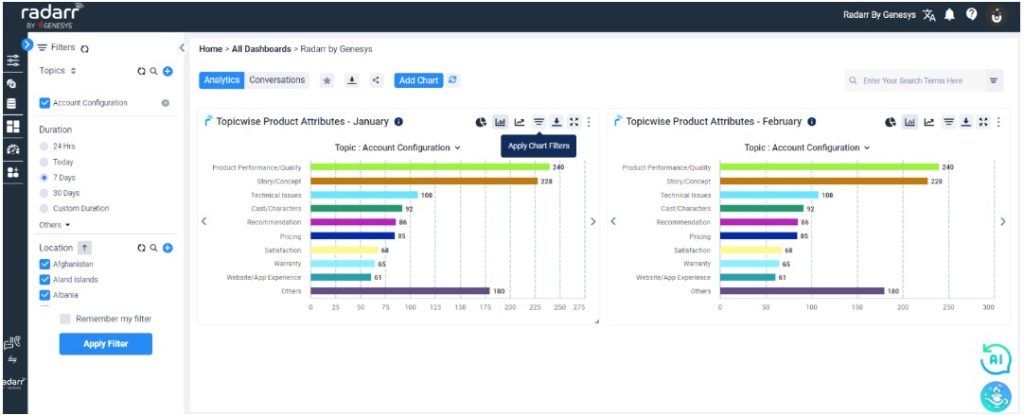
Chart-level filters are tools available in the Radarr by Genesys platform that allow users to refine the data displayed in charts. Chart-level filters are handy for comparing charts between different data sets, such as comparing top influencers over multiple countries or social media mentions over different time frames. Here’s how to use them:
- Click on the “Apply Chart Filters” option.

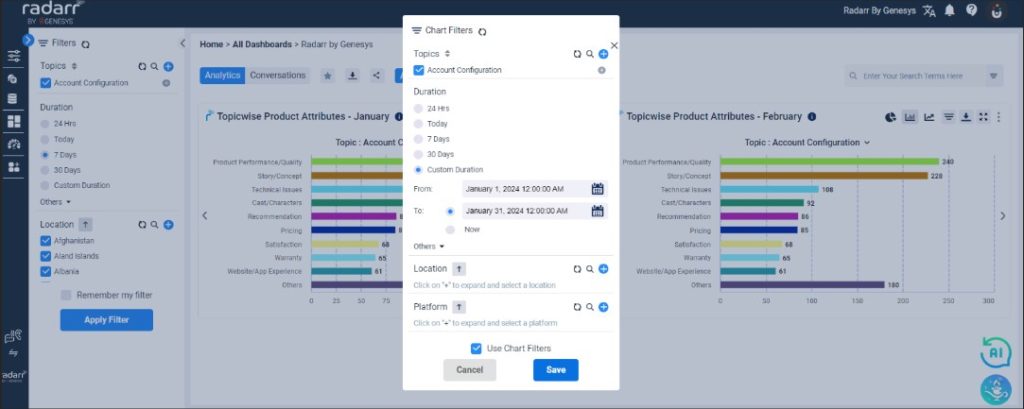
- A dropdown menu will appear, offering options such as Topic, Duration, Location, Platform, Language, and Publications.

- To refine the data, click on the “+” sign to expand and add specific topics of interest. Use the refresh button to clear any previous selections in the dropdown.
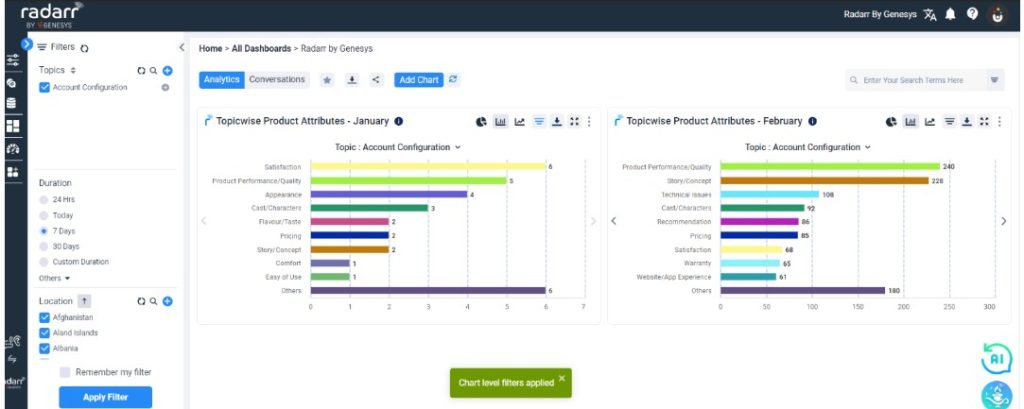
- Once the desired filters are selected, click on “Save” to apply them to the chart.

By utilizing chart-level filters, users can tailor the displayed data to suit their specific preferences and requirements. For example, showing the same chart with data from different durations side-by-side.
